THE ARCTIC GATEWAY
Donate
A selection of maps representing the Arctic sea ice deposits at various points in time.
The Arctic sea-ice extent reaches its annual minimum in September. This map shows the Arctic Sea Ice comparison between the years of the lowest on record 2012 and the years 2019, 2020 (second lowest on record), 2021, 2022, 2023, and 2024.
© Arctic Portal 2006-2026
The Arctic sea-ice extent reaches its annual minimum in September. This map shows the Arctic Sea Ice comparison between the years of the lowest on record 2012 and the years 2019, 2020 (second lowest on record), 2021, 2022, 2023, 2024 and 2025.
This map shows the Arctic sea ice deposits extent at annual minimum in September 2023 and at annual maximum in February 2023.
The map also includes the Median ice edge line for September and February 1981-2010.
This map shows the Arctic sea ice deposits extent at annual minimum in September 2024 and at annual maximum in February 2024.
This map shows the Arctic sea ice deposits extent at annual minimum in September 2025 and Median ice edge line September 1981-2010
This map shows the Arctic sea ice deposits extent at annual minimum in September 2025 and at annual maximum in February 2025. It includes also Median ice edge line for February and September 1981-2010.
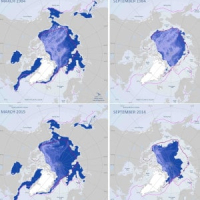
This map shows the sea ice extent at its winter highest in February 2015, and the February median line 1981-2010.Additional maps are available for the period from 1979 to 2015; please contact info at arcticportal.org.
This map shows the sea ice extent at its winter highest in March 2016, and the March median line 1981-2010.Additional maps are available for the period from 1979 to 2015; please contact info at arcticportal.org.
This map shows the sea ice extent at its summer lowest in September 2014, and the September median line 1981-2010.Additional maps are available for the period from 1979 to 2015; please contact info at arcticportal.org.
This map shows the sea ice extent at its summer lowest in September 2015, and the September median line 1981-2010.Additional maps are available for the period from 1979 to 2015; please contact info at arcticportal.org.
This map shows the sea ice extent both at its summer lowest, September 2014, and at the winter highest, February 2015, and the median line for February and September 1981-2010.Additional maps are available for the period from 1979 to 2015; please contact info at arcticportal.org.
This map shows the sea-ice extent both at its summer lowest, September 2015 and winter highest, March 2016, and the median line for March and September 1981-2010.Additional maps are available for the period from 1979 to 2015; please contact info at arcticportal.org.
This map shows the sea-ice extent both at its winter highest and summer lowest, 2015, and the median line for February and September 1981-2010.Additional maps are available for the period from 1979 to 2015; please contact info at arcticportal.org.
This map shows the main paths of the ice drifting from the Arctic.